Safe-district Democrats got more liberal. All Republicans got more conservative.
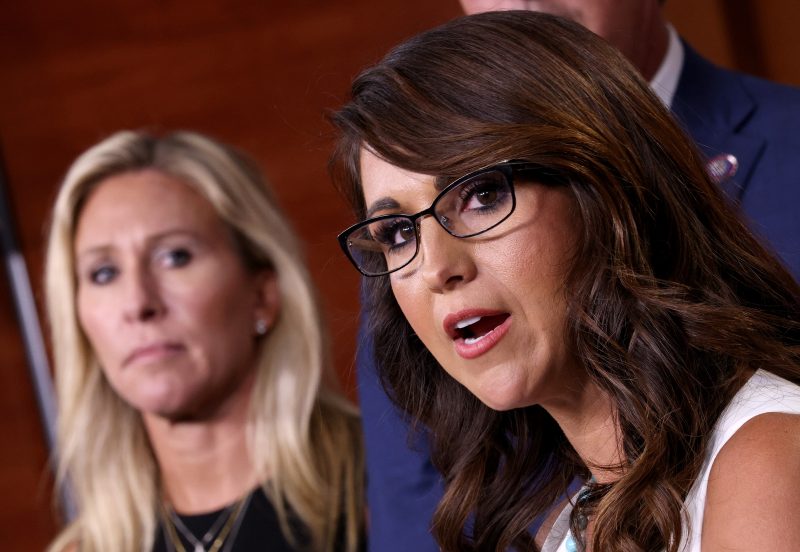
In theory, it should have been Rep.-elect Lauren Boebert (R-Colo.) who was cozying up to Rep.-elect Kevin McCarthy (R-Calif.) as he was trying to secure the votes necessary to be elected House speaker last month. Boebert, after all, represents a narrowly Republican district in a blue state and squeaked to reelection last year by a shockingly narrow margin. Given that McCarthy’s opposition mostly came from his ideological right — and that the vote was centered on pulling him in that same direction — one might have expected Boebert to play a more moderating force.
Instead, that came from Rep.-elect Marjorie Taylor Greene (R-Ga.). Greene personifies the right-wing fringe of the Republican caucus in the House, a status she’s earned through hard work and unswerving commitment to achieving that position. Having won her own reelection bid by a yawning margin, she could well have battled McCarthy ferociously without having to worry about her constituents. But she didn’t, capping off her long effort to access the power held by the establishment by becoming a loyal ally to the eventual speaker.
The conventional wisdom, it seems safe to say, is that elected officials from safer seats are more likely to hold ideological positions closer to the extreme, meaning that a Boebert should be more moderate than a Greene. But an analysis of House elections since 1976 shows that this is only true for Democrats.
Using data on elections from MIT’s Election Data + Science Lab and, for 2022, Cook Political Report, I compared margins of victory with ideology as measured by VoteView. The result was this complicated chart, which — don’t worry — I’ll explain below.
What’s shown is the margin in each House contest, from the biggest margin for Democrats (at bottom) to the biggest margin for Republicans (at top). From left to right, we have a measure of ideology, from most liberal to most conservative. So a dot at top right is a very conservative Republican member of the House who won by a wide margin. The dots are colored by year, from red to yellow to blue, showing movement from 1976 to 2022 elections.
You’ll notice that the blue dots are less spread out than the red ones; in other words that there was less ideological conformity in 1976 than in 2022. This is a bit misleading visually since the blue dots are shown on top of the red ones. But if we isolate those two years, you can see that it’s true, particularly among Democrats (shown in the bottom half of the graph).
What you really want to notice, though, is the jump that occurs in the top half of the graph. The dots move from near the middle of the chart (more moderate) to the right (more conservative). There’s a condensing among the Democrats, but not the same jump.
We can measure the extent of the relationship between election margins and ideology using something called the correlation coefficient. A score of zero shows no correlation between two sets of data; a score of one shows perfect correlation (but not necessarily causation). Since 2000, the correlation coefficient has been over 0.8 — plateauing after that point.
That correlation is boosted because of the consistency between Democratic politics and liberal ideology and so on. If we look only at the correlation within the two parties, there’s a divide: The correlation for Democrats in 2022 was about three times the value for Republicans — because Democrats were more likely to be more liberal if they represented more Democratic seats.
In 2022, the average ideology score of a Democrat who won his or her seat by more than 55 points was -0.492. Among those who won by 5 to 25 points, it was -0.351. Among Republicans who won by 5 to 25 points, the average was 0.476 points. Among those who won by the widest margin, it was 0.534. In other words, there was a 0.14 point difference among those Democratic groups but only a 0.06 difference among the Republican groups.
We can see the difference over time, too. Since 1976, Democrats who won by wider margins have gotten more liberal while those who won more narrowly stayed in about the same place ideologically. Among Republicans, though, every group got more conservative to about the same extent, regardless of the margin of victory they enjoyed.
It’s not new information that Republicans have gotten more ideologically extreme than Democrats over time. It’s also not new that safer districts tend to see more ideologically extreme representatives. What this data shows, though, is that the Greene-Boebert divide isn’t itself odd, for one reason: They’re both Republicans.